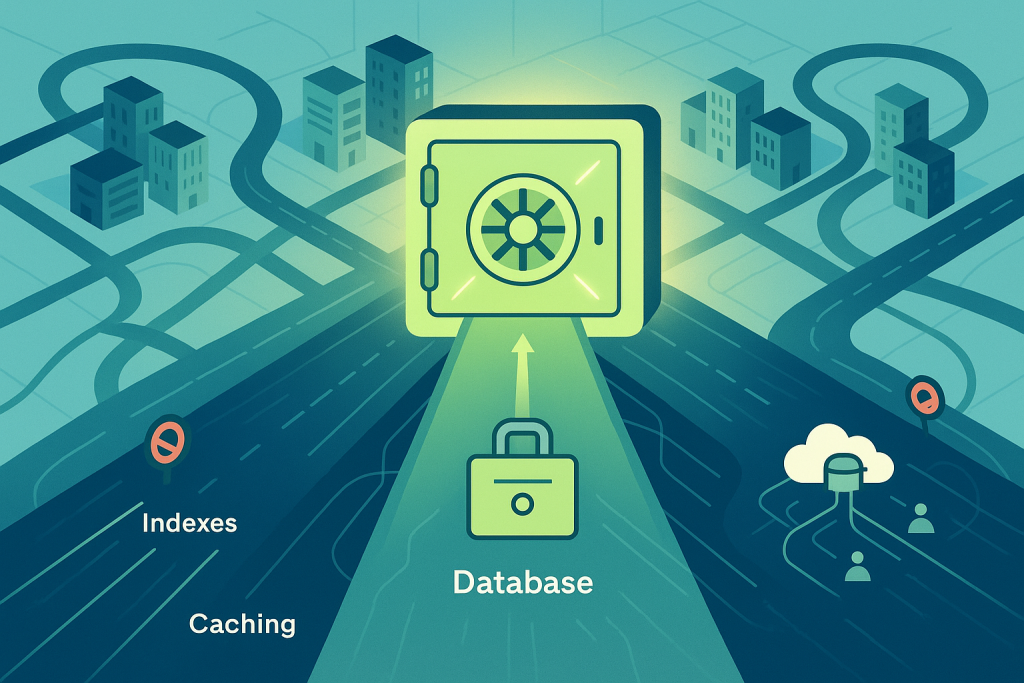
Imagine your website is a massive, bustling city. The roads are filled with cars (user requests), and your main warehouse—the database—is where everything is stored and retrieved.
When traffic is low, the delivery trucks (queries) can get in, grab their packages, and get out easily. But when traffic explodes—a viral post, a major sale, or a sudden news event—your roads get clogged, the warehouse gets overwhelmed, and everything slows down. This is what a slow database feels like on a high-traffic website. Your users get frustrated, they leave, and your business suffers.
Database optimization, in simple terms, is like upgrading your city’s infrastructure. We’re not just adding more roads; we’re building express lanes, creating a highly efficient filing system, and using faster delivery methods.
The crucial part? We need to do this without breaking anything. A database holds your most valuable asset—your data—and reckless changes can lead to disaster.
This guide will walk you through deep, genuinely useful, and safe strategies to optimize your database for massive traffic. We’ll focus on the core concepts: Queries, Indexing, Architecture, and Caching, making sure you understand the why before you implement the how.
Part 1: The Core Foundation – Optimizing Your SQL Queries (The Express Lanes)
The biggest performance bottleneck is almost always inefficient queries. A poorly written query can force your database to look through millions of rows to find a single piece of information, turning a millisecond task into a second-long disaster.
1. Identify the Culprits: Find Your Slowest Queries
You can’t fix what you can’t see. The very first step is to use tools to identify your Top 10 Slowest Queries.
- How to do it (Safely):
- Enable Slow Query Logging: Almost every database (MySQL, PostgreSQL, etc.) has a built-in feature to log any query that takes longer than a specified time (e.g., 500ms or 1 second). Start with a high limit (like 5 seconds) and slowly reduce it.
- Use APM Tools: Application Performance Monitoring tools (like New Relic, Datadog, or even your hosting provider’s metrics) give you a real-time view of query times, execution counts, and resource consumption.
- The Goal: You need to know the exact text of the query, the table(s) it runs on, and its average execution time.
2. The EXPLAIN Command: The Query Map
Once you have a slow query, the EXPLAIN (or EXPLAIN ANALYZE) command is your secret weapon. It shows you the execution plan—the exact route the database engine takes to process your request.
- What to look for:
- Full Table Scans: This is the worst. It means the database is reading every single row of a table to find what it needs. A good execution plan should show the use of indexes.
- Inefficient Joins: See if the database is joining tables in a confusing or resource-intensive order.
- Temporary Tables/Sorting: If the plan shows a lot of time spent creating temporary tables or sorting data, it usually means you’re missing a critical index.
3. Rewriting for Speed: Simple Query Best Practices
With the execution plan in hand, you can rewrite the query. These simple changes are safe and provide massive returns:
A. Never Use SELECT *
This is the most common and easiest mistake to fix. SELECT * tells the database to pull back all columns, including large text fields (BLOBs/TEXT) that you don’t need.
- Bad:
SELECT * FROM products WHERE category_id = 5; - Good:
SELECT id, name, price, stock_level FROM products WHERE category_id = 5;- Why it helps: Reduces the data the database has to read from disk, transfer over the network, and store in memory.
B. Limit the Data You Retrieve
If you only need 20 results for a page, don’t ask for 1,000.
- Always use
WHEREclauses to filter results down to the absolute minimum set of rows. - Always use
LIMITandOFFSETfor pagination to only return the necessary slice of data.
C. Be Wary of Functions in WHERE Clauses
Applying a function to a column in your WHERE clause (e.g., WHERE YEAR(order_date) = 2024) will prevent the use of indexes on that column. The database has to calculate the function for every single row before it can compare it.
- Bad (Avoids Index):
SELECT * FROM orders WHERE DATE(created_at) = '2024-10-13'; - Good (Uses Index):
SELECT * FROM orders WHERE created_at >= '2024-10-13 00:00:00' AND created_at < '2024-10-14 00:00:00';
Part 2: The Filing System – Indexing Strategies (The Card Catalog)
Indexes are the single most powerful tool for speeding up read operations. Think of an index like the alphabetical card catalog in a massive library. Instead of looking through every book (Full Table Scan), you can go straight to the card (Index) to find the exact location of the data.
The Index Trade-Off: While indexes make reads (SELECTs) lightning-fast, they make writes (INSERTs, UPDATEs, DELETEs) slightly slower. Why? Because every time you change data, the index also has to be updated. For high-traffic websites, which are usually read-heavy, this trade-off is absolutely worth it.
4. Index the Right Columns
Don’t just index everything. Over-indexing wastes storage space and slows down writes unnecessarily.
- Index Candidates (Columns that are your best friends):
WHEREclauses: Columns you filter by (e.g.,user_id,status,category).JOINconditions: Columns used to link tables (e.g.,product_idin theorderstable).ORDER BYandGROUP BY: Columns you use to sort or aggregate data.- Foreign Keys: Essential for maintaining relational integrity and speeding up joins.
- Index Columns to Avoid (Columns that are not good candidates):
- Columns with very few unique values (low cardinality), like a
boolean(true/false) column. An index on a column that is 99% ‘True’ is useless, as the database will likely just scan the table anyway. - Columns that are constantly being updated (too much overhead).
- Columns with very few unique values (low cardinality), like a
5. Mastering Composite Indexes
A composite index is an index on two or more columns, in a specific order. This is vital for queries that filter on multiple conditions.
- Scenario: You frequently run the query:
SELECT * FROM products WHERE category_id = 5 AND is_active = 1 ORDER BY price DESC; - The Key Rule: The Leftmost Prefix
- An index on
(category_id, is_active, price)will be used efficiently by your query. - It will also be used by any query that only uses the leftmost part:
WHERE category_id = 5(Yes)WHERE category_id = 5 AND is_active = 1(Yes)
- It will not be used (or will be used poorly) by a query that skips the first column:
WHERE is_active = 1(No)WHERE price < 100(No)
- An index on
- The Strategy: Put the column you filter on the most and/or the one with the highest selectivity (most unique values) first in the composite index.
6. The “Covering Index” Trick
A covering index is an index that includes all the columns needed to satisfy a query, meaning the database never has to look at the main table data at all.
- Query:
SELECT name, price FROM products WHERE category_id = 5; - Covering Index: An index on
(category_id, name, price).- The database finds the rows matching
category_id = 5in the index, and because thenameandpriceare also stored right there in the index, it can return the result immediately. This eliminates the “fetch data” step entirely, leading to enormous performance gains for read-heavy operations.
- The database finds the rows matching
Part 3: Scaling Up – Caching and Read/Write Separation
Once you’ve made your queries and indexes as efficient as possible, the next step is to change how you access the database to handle the load of thousands of simultaneous users. This is where scaling architecture comes in.
7. The Power of Caching (The Super-Fast Temporary Storage)
Caching is the strategy of storing the result of a database query in a super-fast, temporary memory location (like Redis or Memcached) before the request even hits the main database.
- When to Cache: Cache the results of complex, slow queries or data that is read frequently but rarely changes (e.g., product lists, navigation menus, user profile data).
- Caching Strategy: Cache-Aside
- Application receives a request for data (e.g., a product page).
- Application checks the Cache first.
- Cache Hit: If the data is found, it’s served immediately—the database is never touched. (Latency: <5ms)
- Cache Miss: If the data is not found, the application runs the query on the Database.
- The application then stores this new data in the Cache (for the next request) and serves it to the user.
- Cache Invalidation (The Hard Part): When the data changes in the database (e.g., a product price is updated), you must delete or update the old, stale data in the cache. This ensures users don’t see outdated information. This is often done by giving cached data a Time-to-Live (TTL), after which it expires automatically.
8. Database Replication (Read/Write Splitting)
Most high-traffic websites have a 10:1 or even 100:1 read-to-write ratio (many users viewing, few users creating/editing). Why should a read request compete with a write request? It shouldn’t.
- The Solution: Master-Slave Replication
- Master Database (The Writer): This is the only database that handles
INSERT,UPDATE, andDELETEoperations. It ensures data consistency. - Slave Databases (The Readers): The Master constantly copies all its data changes to one or more Slave databases. These slaves handle all the
SELECT(read) traffic.
- Master Database (The Writer): This is the only database that handles
- The Benefit (Safety and Speed):
- It spreads the load across multiple servers.
- Reads run on dedicated, un-stressed servers.
- Writes are isolated, preventing slow reads from locking up the system while a big update runs.
- The Trade-Off (The Small Risk): Replication Lag
- Because copying data takes a tiny fraction of a second, a user who writes data (e.g., posts a comment) might try to immediately read that data from a Slave server and find it’s not there yet. This is called replication lag.
- Mitigation: For critical “read-your-own-write” actions (like viewing a new comment), temporarily route the user’s read request back to the Master database to guarantee they see the freshest data.
Part 4: Maintenance and Hardware (The Unsung Heroes)
Even the best-optimized database will slow down over time without regular care.
9. VACUUM and Table Maintenance (The Spring Cleaning)
Databases like PostgreSQL and MySQL are constantly deleting and updating data. When a row is “deleted,” it’s often just marked for deletion and the space is reused later. This process can lead to:
- Table Fragmentation: The data gets scattered physically on the disk, making the disk head work harder (slower I/O).
- Dead Space (Bloat): Unused storage space inside the table and index files.
- The Fix: Databases have built-in commands like
VACUUM(PostgreSQL) orOPTIMIZE TABLE(MySQL). Running these commands regularly cleans up the dead space and reorganizes the table structure, keeping your file system tight and fast. Always run maintenance during low-traffic periods!
10. Hardware and Configuration Tuning
Sometimes, the database is perfectly healthy, but the server is bottlenecked.
- Buffer Pool / Shared Buffer Size: This is the most critical setting. It determines how much of your server’s RAM is dedicated to caching the actual data and index pages. If your entire active dataset fits in the buffer pool, your database will rarely need to hit the slower disk (SSD/NVMe)—it’s all happening in RAM!
- Rule of Thumb: Dedicate 50-80% of your total server RAM to this.
- Use NVMe SSDs: If you are not using modern Solid-State Drives (SSDs), or better yet, NVMe drives, this is the single fastest hardware upgrade you can make. Database performance is heavily dependent on Disk I/O (how fast data can be read from the disk), and NVMe is exponentially faster than older HDD or even standard SATA SSD technology.
11. Connection Pooling
A high-traffic website often opens and closes hundreds or thousands of database connections per second. Creating a new connection is a slow, resource-intensive task.
- The Solution: Connection Pooling. Instead of closing connections after each use, the application keeps a set pool of connections open and ready to use. When a request comes in, it borrows a connection from the pool, uses it, and then returns it to the pool (instead of closing it).
- Benefit: Dramatically reduces connection overhead and allows the database to handle far more simultaneous traffic with less stress. Tools like PgBouncer (PostgreSQL) or built-in web server/framework connection managers are essential for this.
The Safe Optimization Roadmap: A Step-by-Step Plan
Remember, the mantra is “Without Breaking Anything.” Don’t implement all these changes at once. Follow this low-risk roadmap:
- Monitor & Benchmark: Establish a baseline. Start slow query logging and record your average query times, CPU usage, and latency.
- Quick Wins (Phase 1: Safe SQL):
- Audit your Top 10 Slowest Queries using
EXPLAIN. - Eliminate all
SELECT *statements. - Ensure all pagination uses
LIMIT/OFFSET.
- Audit your Top 10 Slowest Queries using
- Indexing (Phase 2: High-Return/Low-Risk):
- Create missing indexes identified by the
EXPLAINanalysis onWHERE,JOIN, andORDER BYcolumns. - Test the performance of the slow queries again.
- Create missing indexes identified by the
- Capping & Pooling (Phase 3: Architecture):
- Implement Connection Pooling to manage connections more efficiently.
- Implement Caching (Redis/Memcached) for the most read-heavy, static data.
- Scaling (Phase 4: Scaling-Up):
- Tune your Buffer Pool size in your database configuration.
- Implement Read/Write Splitting with a Master/Slave setup, routing all new read traffic to the Slave(s).
By following this deep, structured approach—starting with efficient queries and moving up to architectural scaling and caching—you can ensure your database not only survives a traffic spike but thrives under the pressure, delivering a fast, seamless experience to every user in your bustling online city.